




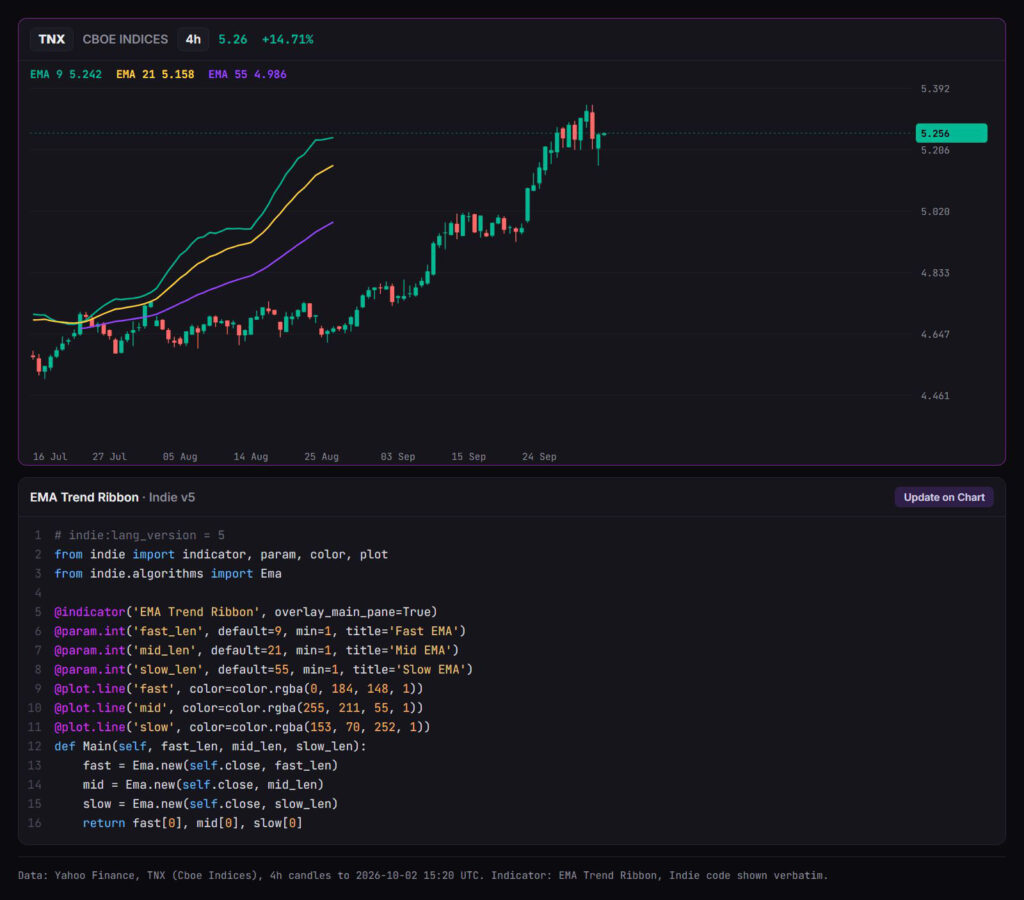
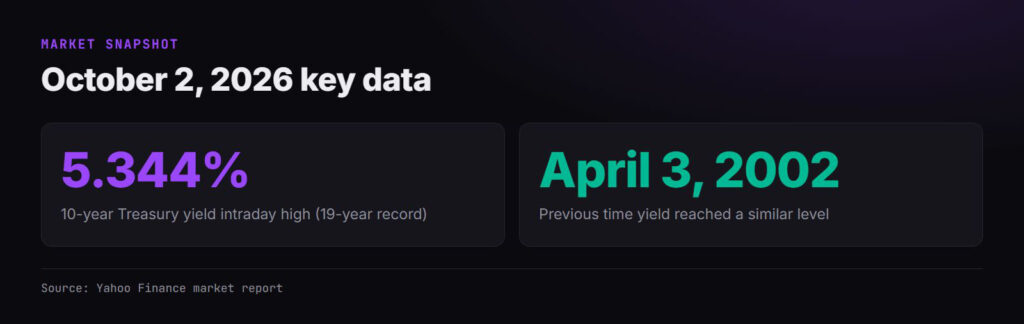
The 10-year U.S. Treasury yield reached 5.344% on October 2, 2026 — the highest reading since April 2002 — compressing valuation multiples across the technology sector. The move highlighted some of the practical limitations traders can encounter when monitoring several markets on free plans.
A single rate, a broad revaluation
The intraday reading, the highest since April 2002, was reported by Yahoo Finance’s October 2 market coverage. Higher yields translate directly into higher discount rates, which reduce the present value of future earnings. For technology stocks—many of which are priced on multi-year growth assumptions—the effect is immediate and broad.
The 10-year yield had been climbing throughout the year, repeatedly pressuring the sector, according to coverage from Barron’s and Schwab. The October 2 spike extended a months-long trend. High-growth AI and semiconductor names, which had attracted substantial inflows earlier in 2026, saw their implied valuations contract as the macro rate reset higher.
The broader macro environment reflected this tension. OpenAI’s annualized revenue run rate reached approximately $70 billion by mid-2026, and Microsoft’s AI cloud services continued to outpace analyst estimates, keeping institutional capital flowing into tech. But even these powerful narratives were not enough to insulate the sector from a rate shock. The yield move trimmed the valuation cushion that low rates had provided.
The sensitivity of tech stocks to yield changes is rooted in their valuation models. A company whose share price assumes strong cash flows five or ten years out will see that assumption repriced when the benchmark yield jumps. The compression is not uniform—shorter-duration names suffer less—but the tech sector’s composition skews long-duration.
The yield environment also influenced capital flows elsewhere. In the first week of October, digital-asset investment products recorded significant weekly inflows, with bitcoin-focused funds drawing the largest share, according to fund-flow trackers for the period. Schwab Network noted that sentiment in AI-related memory names had become more mixed, with some participants expecting a slower fourth quarter.
Free-plan limits meet a cross-asset moment
For retail traders, tracking the yield curve alongside a tech watchlist is a cross-asset workflow that many free charting plans were not designed for. TradingView’s free Basic plan restricts price alerts, saved layouts, and indicator limits, according to third-party comparisons published in 2026. The constraint is not about data access—public exchanges provide plenty of numbers—but about the capacity to run two unrelated charting sessions in parallel without upgrading.
Alternatives do exist, but each comes with trade-offs. Thinkorswim by Charles Schwab offers free multi-asset charting to clients, covering stocks, options, futures, and forex. It requires a Schwab brokerage account, which may not suit every trader. MetaTrader 5 is free to download but instrument access is controlled by the supporting broker, so a user cannot independently choose which markets to chart. NinjaTrader provides free charting and backtesting, making it relevant for futures traders. Investing.com offers a free alternative with broad market data, while Koyfin provides a watchlist and macro-screening tool.
The differences extend beyond instrument coverage. Some free plans, like thinkorswim, integrate directly with a brokerage; others, like Investing.com, focus on data display and analysis. No single free tier covers every need out of the box.
For a side-by-side look at which platforms offer free multi-asset charts and how many alerts each plan allows, see the table in a ranking of 15 TradingView alternatives.
The comparison makes clear that no single free plan covers every instrument with full alert capacity. A trader monitoring tech stocks and the 10-year yield simultaneously may need to use two platforms or find a paid plan that accommodates both.
Beyond the preset library
Macro-driven rotations are not isolated events. Sustained high rates invite long-term monitoring, and a fixed library of indicators can become a bottleneck when a trader needs a cross-asset logic—for example, an alert that triggers on a spread between a stock price and the 10-year yield.
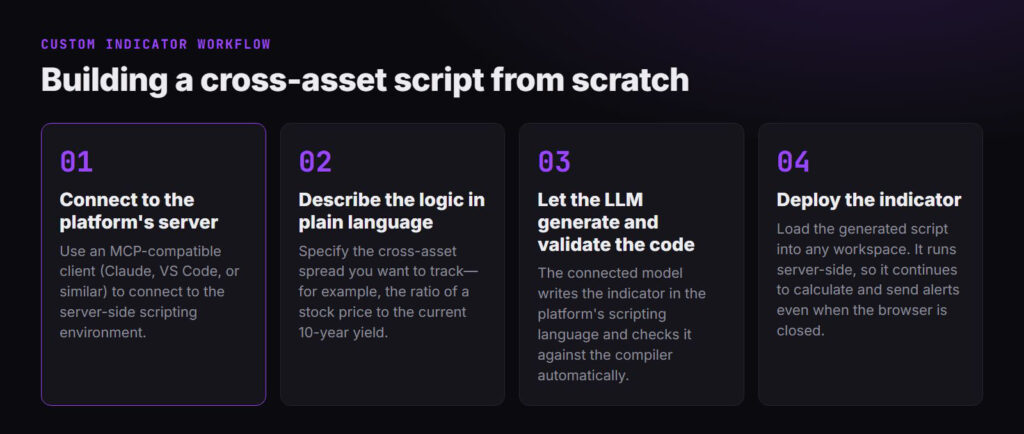
Some platforms address this by making their indicator source code available for modification. TakeProfit ships every built-in indicator as open source, written in a Python-like scripting language called Indie. The official documentation provides the syntax and library reference, and an MCP server lets traders generate custom indicators by describing the desired logic in plain language to a connected LLM, which writes and validates the code before the trader needs to deploy it. A trader tracking a tech stock’s price relative to the current 10-year yield, for instance, could describe that ratio in simple terms and receive a working script in a single session.
The open-source nature of the indicator library removes dependency on vendor update cycles. A trader can fork an existing moving average script and attach it to a yield-spread logic rather than waiting for a new indicator to appear in a menu. Server-side execution means that once the script is deployed, it continues to process data and trigger alerts even when the user is not actively watching the screen. The same environment enables backtesting over years of historical data, allowing a trader to test a yield-spread strategy against past rate cycles before committing capital.
Bottom line
The October 2 yield spike was a reminder that macro financial variables can override sector-specific narratives with little warning. For traders, the event underscores the value of tooling that spans asset classes, provides clearly disclosed plan limits, and offers a path to custom logic when preset indicators are insufficient.
This article is for informational purposes only and does not constitute investment advice.